This article was written by Cori Burcham.
Each month, the U.S. Bureau of Labor Statistics (BLS) publishes a single number – most recently 4.3% in September 2025 – that’s often used as a quick snapshot of the economy’s health. That figure, which represents the percentage of individuals in the labor force who are actively looking for a job, is often the single unemployment statistic featured in the news or cited by economists, but it doesn’t tell the whole story. Behind it are the very different experiences of people across age, race, gender and background – differences that can get lost when we look only at the national average.
Secondary school and college-level educators from across the country explored this topic at a virtual workshop hosted by the University of Delaware’s Center for Economic Education and Entrepreneurship (CEEE)in the Alfred Lerner College of Business and Economics. Moderated by Megan Kirts, executive director of Econiful and an alumna of UD’s Master of Arts in Economics and Entrepreneurship for Educators program, the event featured Scott Bacon and Amy Krzyzanowski from the CEEE. They provided educators with resources to help students analyze and interpret economic data, preparing them to become data-literate citizens inside and outside of the classroom.
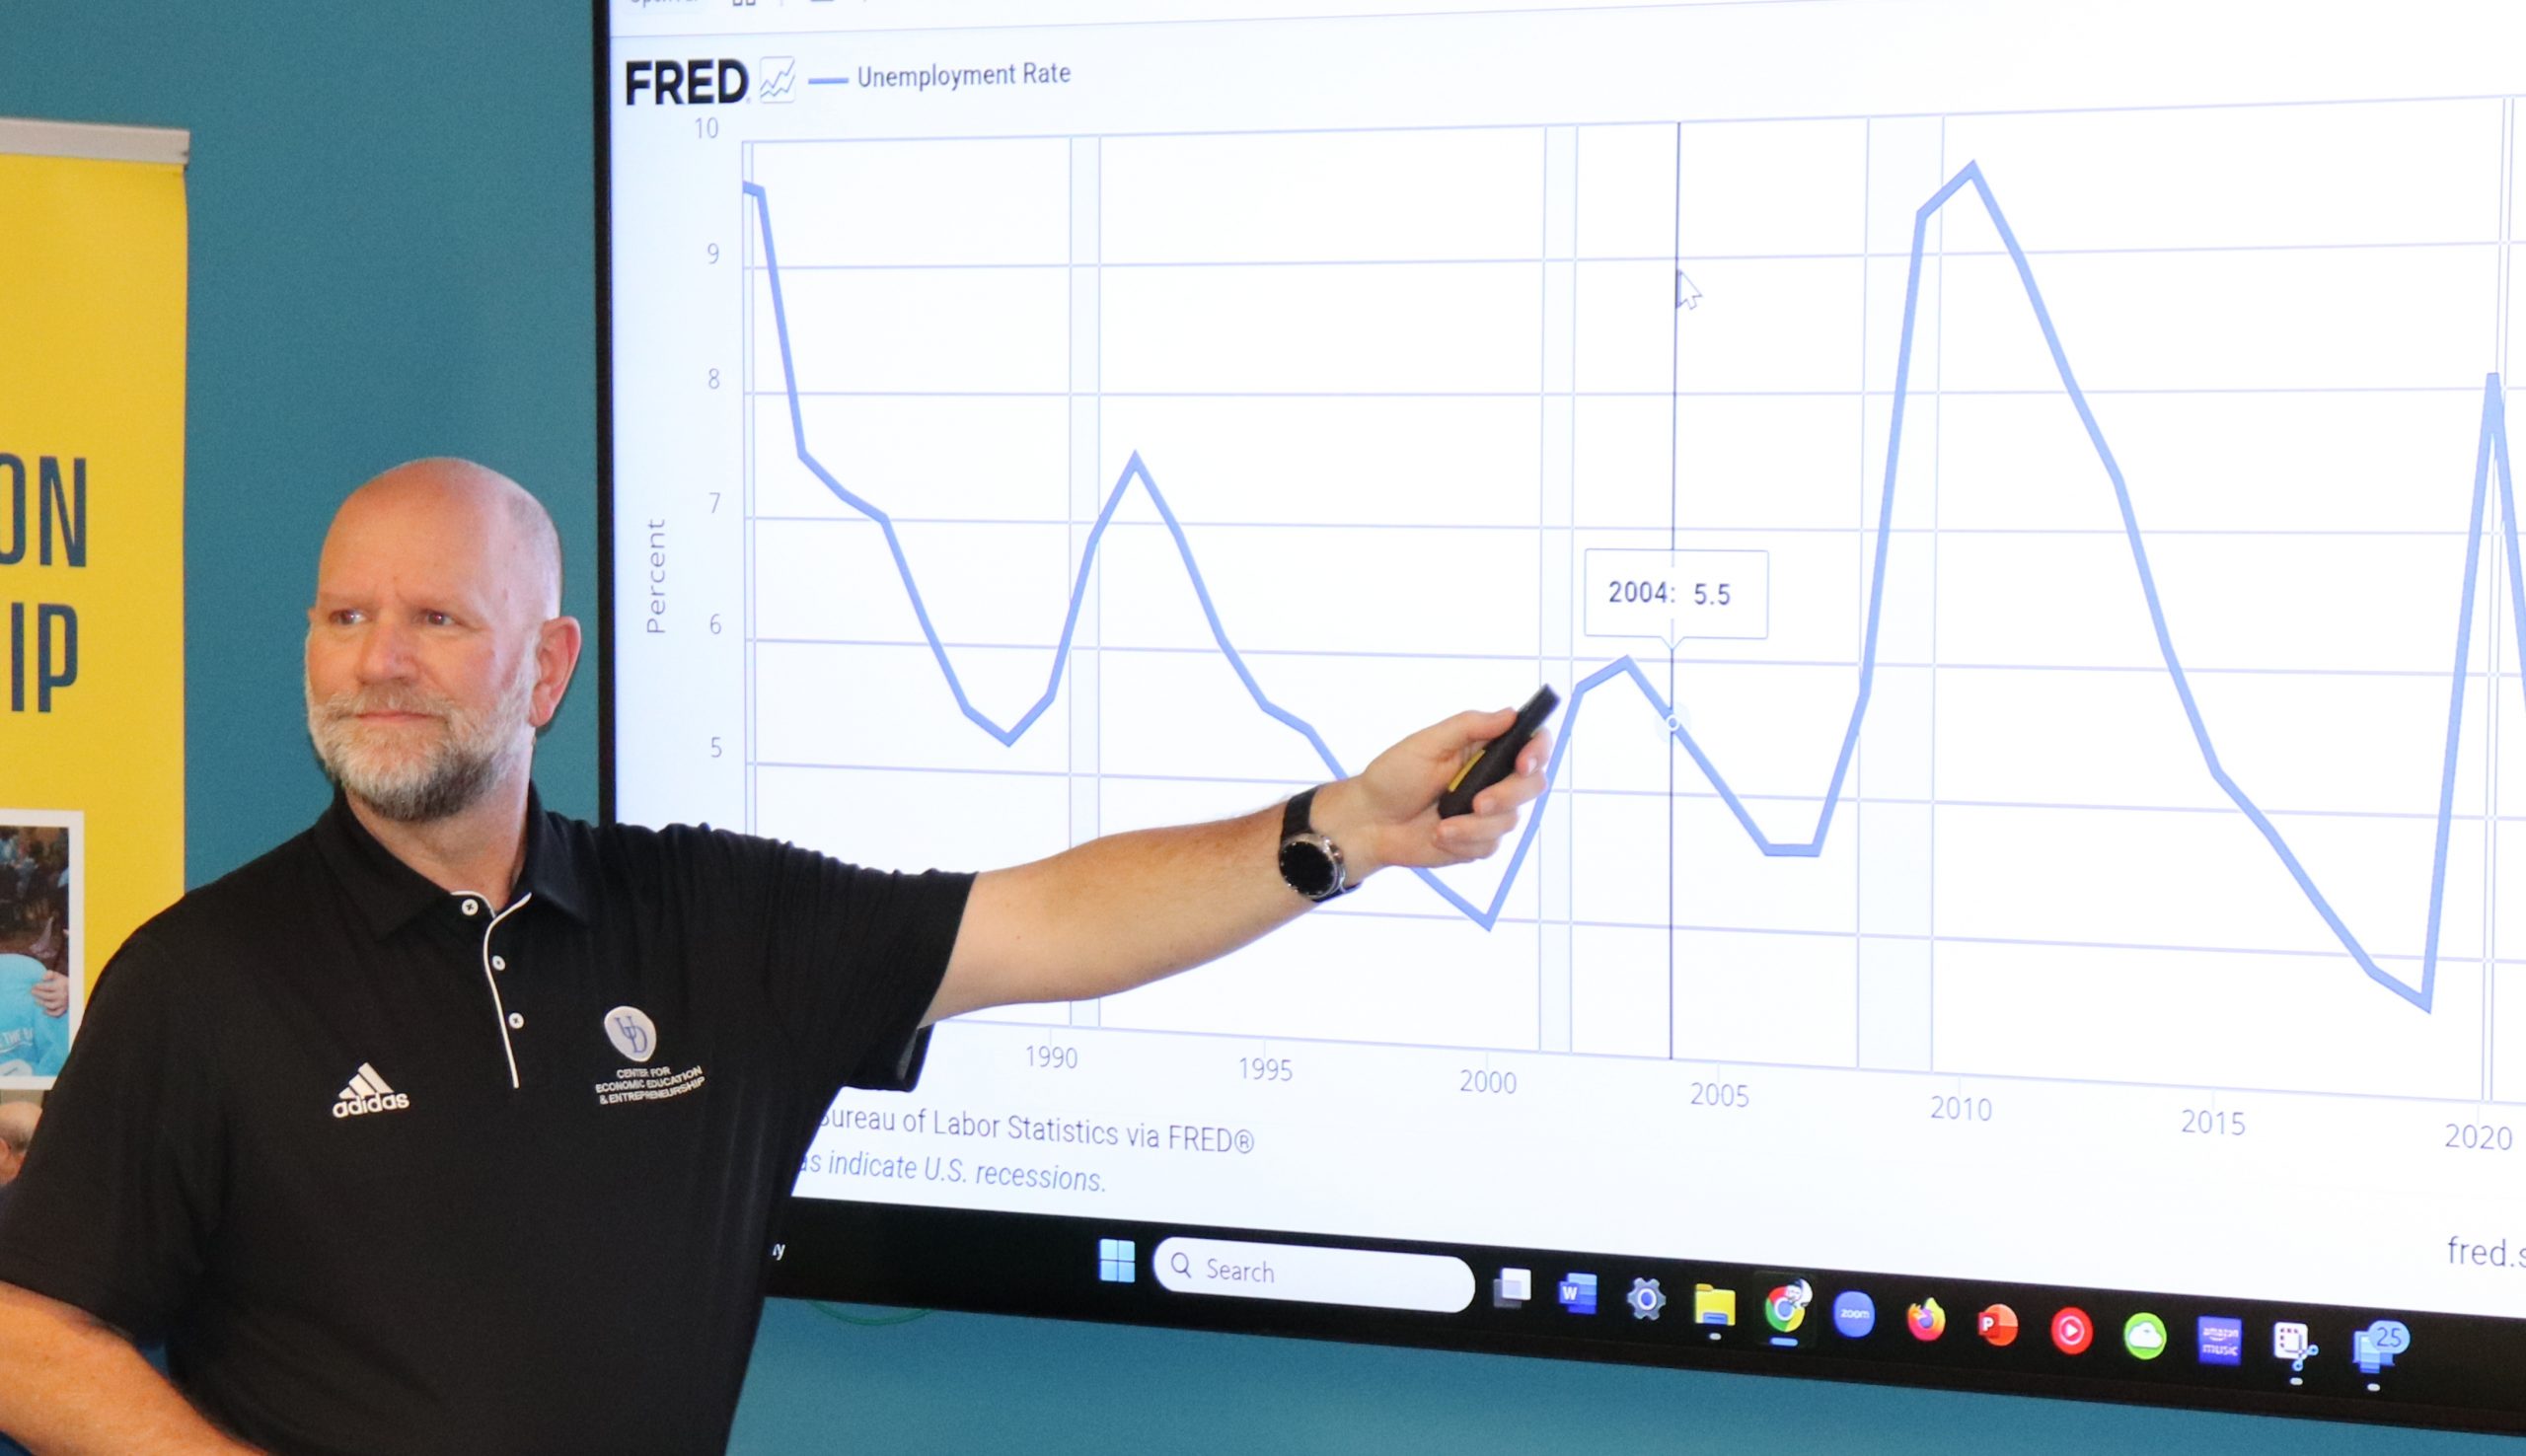
Bacon, assistant director of the CEEE, led the first presentation by reviewing a seventh-grade macroeconomics lesson designed to introduce students to economic indicators such as unemployment, inflation and gross domestic product (GDP). The activity had students practice reading and analyzing graphs featuring unemployment figures from the Federal Reserve Economic Data (FRED), an online public database maintained by the St. Louis Fed’s Research Department, to explore the stories behind the numbers.
“We want to show our students that unemployment — just looking at that one number — doesn’t show us the whole picture of all the other subgroups, categories or demographics that are affected differently by unemployment,” said Bacon, beginning the lesson with an overview of the basics of reading graphs.
Bacon then guided teachers through a series of graphs showing unemployment by group to encourage data comprehension, pattern recognition and reflection on the circumstances that might have influenced the data. One graph comparing unemployment rates between 1980 and 2020 showed that unemployment for men was consistently higher than for women and the national average during recessions, until the pandemic reversed the trend, resulting in the first “she-cession.”
“It bucked the trend. It looks different than our previous four recessions, so that’s definitely something we want our students to be asking questions about. Why is that?” said Bacon.
Another graph displayed unemployment rates by race and ethnicity over the same period, showing that some groups consistently experienced higher unemployment than others.
“We hope your students would be asking, ‘why do some groups experience levels of unemployment at different amounts than other groups?’ We might not have the answers, but we want our students to be curious and asking those questions, and the follow-up is, ‘Can anything be done about it?’” said Bacon.
This graph also illustrates the composition effect, the focus of a presentation by Amy Krzyzanowski, instructional designer for the CEEE. Krzyzanowski guided educators through this lesson developed by the Federal Reserve Bank of St. Louis, which has students break into groups to analyze the unemployment data of different racial and ethnic groups and compare it to the national average.
“[Students] quickly see that the single national statistic just doesn’t fully capture the diverse labor market experiences of different groups,” said Krzyzanowski, noting the next step is to examine how this data is collected.
To calculate the national unemployment rate, the BLS conducts a monthly Current Population Survey (CPS), interviewing 60,000 eligible sample households on their labor activities and status, such as education level, disability, and age, Krzyzanowski noted.
By comparison, the U.S. Census Bureau surveys millions of Americans across eight racial and ethnic categories every 10 years, while the CPS identifies only four groups: Asian, Hispanic or Latino, Black or African American, and White.
Because the CPS sample size is too small to represent the additional four groups reliably, this national rate provides an impression of the job market’s overall health, one that can mask individual experiences.
“Because of the composition effect, national statistics don’t always tell the full story,” Krzyzanowski said. “The unemployment rate helps us interpret the overall health of the economy, but it doesn’t let us zoom in on the labor market experiences of specific groups, whether racial and ethnic groups, different age brackets, or any other demographic category.”
Krzyzanowski also shared an analogy she uses in her own classroom to illustrate the composition effect and help her students better grasp the concept. She asks them to imagine eating a spoonful of chili, where they notice the mix of flavors rather than a single ingredient.
“A national statistic is just like the recipe, right? Just as different ingredients combine to make an overall dish, different demographic groups combine to make an overall number, such as the unemployment rate. But just as you can miss the kidney beans in a bite of chili, you can miss the experience of individual groups when you’re only looking at a national average,” said Krzyzanowski.
Recalling her classroom experiences, Krzyzanowski described the empowering moment when students realized that statistics can be both accurate and misleading — an epiphany that makes them better consumers of data and prepares them for the real world.
By implementing these lessons, teachers help develop inquisitive, data-responsible citizens who can recognize systemic inequities, engage with current events and think critically about statistics. The next time students see the national unemployment rate, as learners or professionals, they’ll remember this single number may not tell the full story.


